ParkerGale Indices: Third Quarter 2023 Earnings Update
What We’re Updating
Today we are updating our indices that we developed in “What’s a Software Company Worth?”. Here is a recap of each index:
PG Growth Equity (PGGE): All public software companies that grew over 25% in a given calendar year irrespective of profitability.
PG Middle Market Buyout (PGMM): All public software companies that grew between 5% and 25% in a given calendar year, while also maintaining at least 10% EBITDA margins in the same year.
PG Growth Equity Small Cap (PGGE-SC): Public software companies with a market cap between $250 million and $2 billion that grew over 25% in a given calendar year irrespective of profitability.
PG Middle Market Buyout Small Cap (PGMM-SC): Public software companies with a market cap between $250 million and $2 billion that grew between 5% and 25% in a given calendar year, while also maintaining at least 10% EBITDA margins in the same year.
We refreshed the data as of November 27, 2023 to capture third quarter actuals. And we updated 2023 forward estimates in our charts for sales and EBITDA multiples, revenue growth, and EBITDA margin.
Before We Dive In
As we enter December, analysts anticipate stable interest rates and project that a decrease in rates will not occur until May 2024. The most recent inflation report provided the Street with confidence that the Fed’s strategy is working. And the report led to a rally in technology stocks. Analysts reduced their expectations of a recession in the next 12 months and the print reignited a narrative that a soft landing was possible.
Over a longer horizon, investors are still cautious on technology shares, driven by mixed messaging on IT spend and risks to consumption models. Plus, the IPO market is still dormant. Recent listings which were expected to be a bellwether for capital markets, are trading below their listing price.
From an operational perspective, optimization trends were a common refrain on earnings calls. A few companies highlighted improvements or stabilization in customer optimizations and their stock rose on the news. Last quarter, we predicted revenue would decelerate over the back half and that has been true. Now with nine months of data, 2023 revenue growth rates are nearly solidified.
Most management teams have not rushed to provide detail on 2024 outlooks; that will likely come during fourth quarter earnings. Without much expectations for a reacceleration of growth, we have begun to ask ourselves, “have we reached the point where 20% growth has become aspirational?” We will not adjust our metrics for the indices, but it is an interesting question to ponder.
How Valuations Reacted After the Third Quarter
EV/Sales
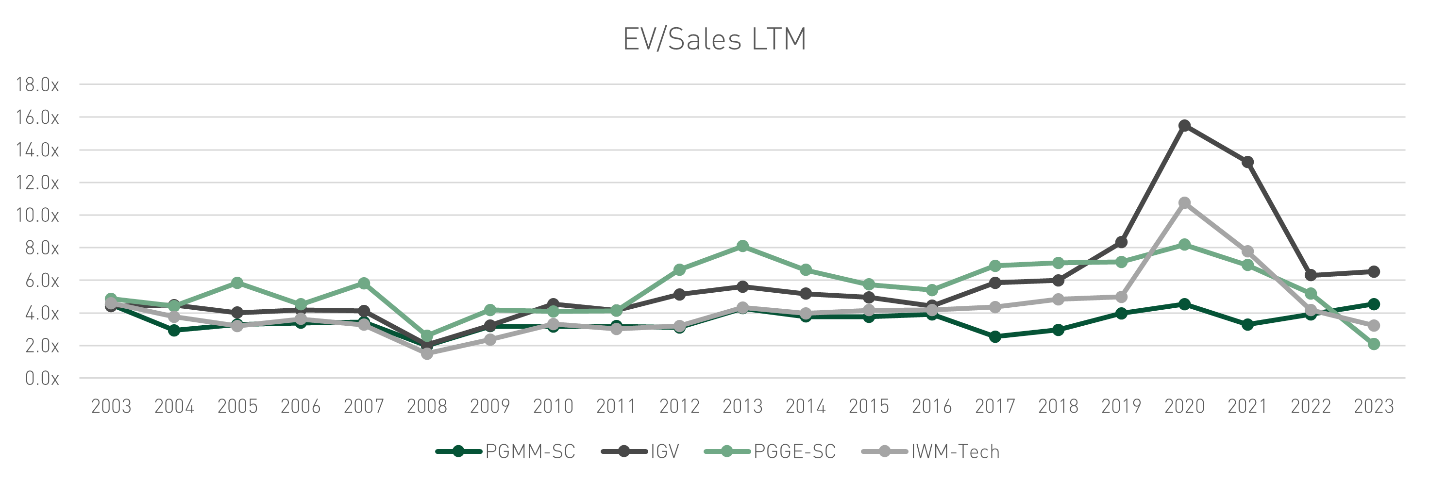
First, we will chart the change in 2023 sales multiples between quarters for ParkerGale Middle Market Buyout (PGMM) and ParkerGale Growth Equity (PGGE). Sales multiples for PGMM companies were unchanged over the first three quarters. While sales multiples for PGGE decreased slightly to 9.5x on average, below the second quarter, but at a premium over the IGV and PGMM.

The line chart below contains sales multiples for PGMM and PGGE compared to IGV. For the third quarter in a row, PGGE and PGMM have converged. The PGGE companies command a slight premium, despite growth deceleration. But investors should weigh the premium we pay for growth versus the lack of profitability. In a low interest rate environment, investors were more willing to accept higher growth and less profitability. In the current interest rate environment coupled with weak demand, costs have risen for companies, and investors have shifted their focus to more profitable PGMM-like companies. Although PGGE companies are more profitable now than past quarters, PGMM’s track record from a multiple perspective provides an opportunity to buy at a valuation floor with the potential for multiple expansion.

This quarter, 18 out of 80 PGMM companies were valued at 10x EV/Sales or higher, and grew revenue on average 17% with EBITDA margins of 36%. In PGGE, nine companies were valued at 10x EV/Sales or higher, and grew revenue on average 35% with EBITDA margins of 9%. Six of those companies were profitable. So, exposure to profitable, fast growing companies is possible, but those companies already trade at a premium.
The 2023 average forward sales multiple for PGMM-SC was 4.5x, unchanged from the first two quarters. Again, PGGE-SC is not meaningful for the second and third quarter because the index contained one company.

Last quarter the fastest growing small cap companies in our index graduated to the PGGE index because they surpassed the market capitalization threshold. Other stocks decelerated in growth and migrated to the PGMM index. In both situations, those small cap companies that achieved growth or profitability metrics like larger peers closed the valuation discount gap.
YoY Sales Growth
Below we chart annual sales growth. The average estimated 2023 sales growth rate for PGGE is 34% quashing hope for reacceleration in the fourth quarter given the expectation is slightly below last quarter. PGMM grew 14%, slightly down from the previous quarter.
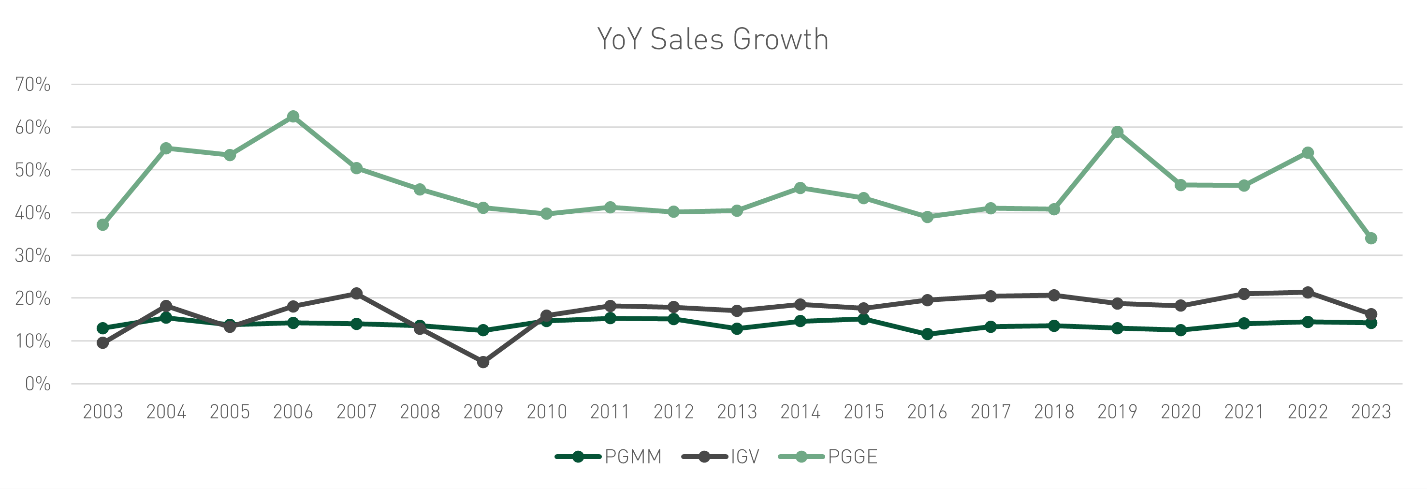
PGMM has steadily grown at this rate, while growth at PGGE companies has steadily declined, dragging down valuations. As an investor, if I buy a stock at a high valuation and growth declines, it becomes difficult to make money over a multi-year period. However, if I identify companies that could reaccelerate growth but are trading at a discount I could be rewarded. Here’s a post (Good Company / Bad Valuation) from our founding partner Devin Mathews explaining that dynamic from a private equity perspective.
In particular, Devin writes, “It is hard to outrun declining growth; it is almost impossible to outrun multiple contraction at the levels we will likely see as these PE-owned software companies come to market.”
We talked about this in the first edition of What’s A Software Company Worth:
“This is the challenge facing public and private investors alike. But it is inevitable. If you paid 15x forward revenue for a company growing 40% a year and break-even, and now you must generate profits, it is very hard to maintain that growth rate. So, you’ve just paid a historically high entry multiple for a PGGE-type company that potentially gets valued in the future like a PGMM-type company on the exit. And the public market data we show above proves this out – in tough times, PGMM and PGGE valuations converge. Tough for PGMM company returns, but potentially catastrophic for PGGE company returns. How this plays out is exactly what all tech-focused buyout and growth equity investors (and their LPs) are waiting to see. It will drive the returns of the recent fund vintages and GP’s abilities to raise funds at the size and pace they’ve become accustomed.”
Historically, when software companies accelerate growth, sales multiples increase. And the next twelve-month revenue growth rate for software companies is in the mid-teens on average, lower than what the market experienced over the past few years. Though it is difficult to time when a reacceleration in growth will occur.
EV/EBITDA
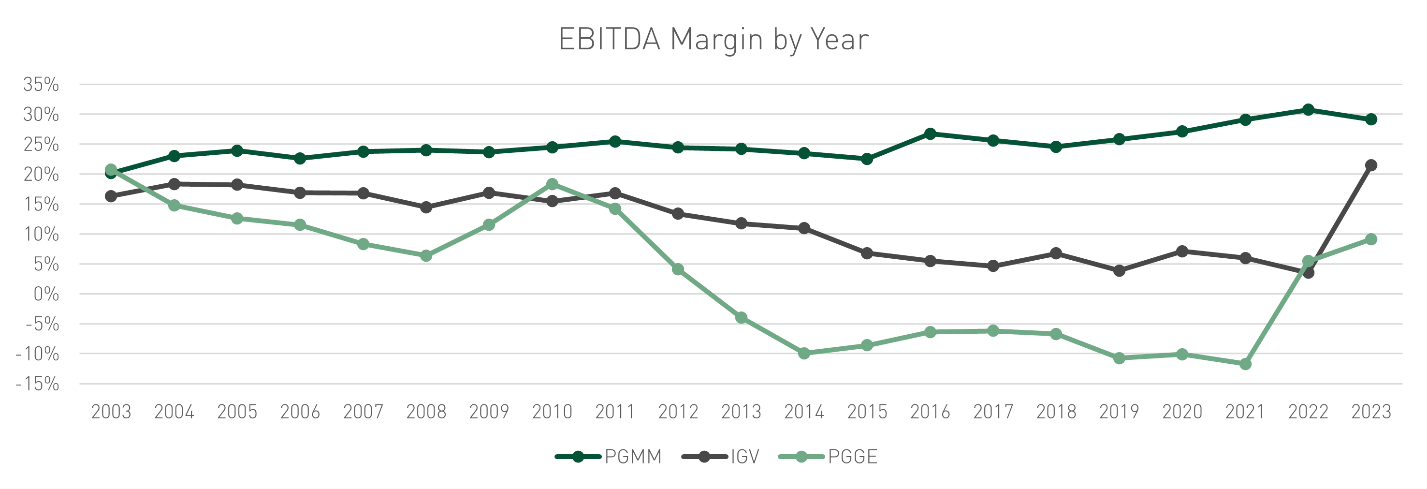
Finally, we examine EBITDA margins and multiples for our indices. EBITDA multiples increased for PGMM as margins went to 29% from 31% driven by new entrants with lower margins. The companies transitioning from growth likely cut expenses, but have not yet achieved profitability levels of the PGMM stalwarts. PGMM-SC had stable margins of 20% and continues to trade in the 20x to 25x EBITDA range, providing a base line for exit expectations.
PGGE margins went to 9%, encapsulating the cost-cutting narrative over the past nine months from software companies. Next year we should see a full year benefit of cost-cutting measures, resulting in continued EBITDA margin improvement.


Since we have one more quarter left of 2023, let’s look at the Rule of 40, a popular metric for evaluating software companies. To calculate rule of 40, we add the estimated 2023 revenue growth rate and estimated 2023 EBITDA margin. I concede that a better measure is ARR growth, but to simplify and include a larger universe of companies we will use revenue growth. Primarily, I want to illustrate the Rule of 40 as a directional tool to understand the focus of companies in each index.
The chart shows that PGMM and PGGE arrive at the Rule of 40 in two different ways, and that PGGE companies have relied on EBITDA margins more to achieve that rule over the past two quarters.

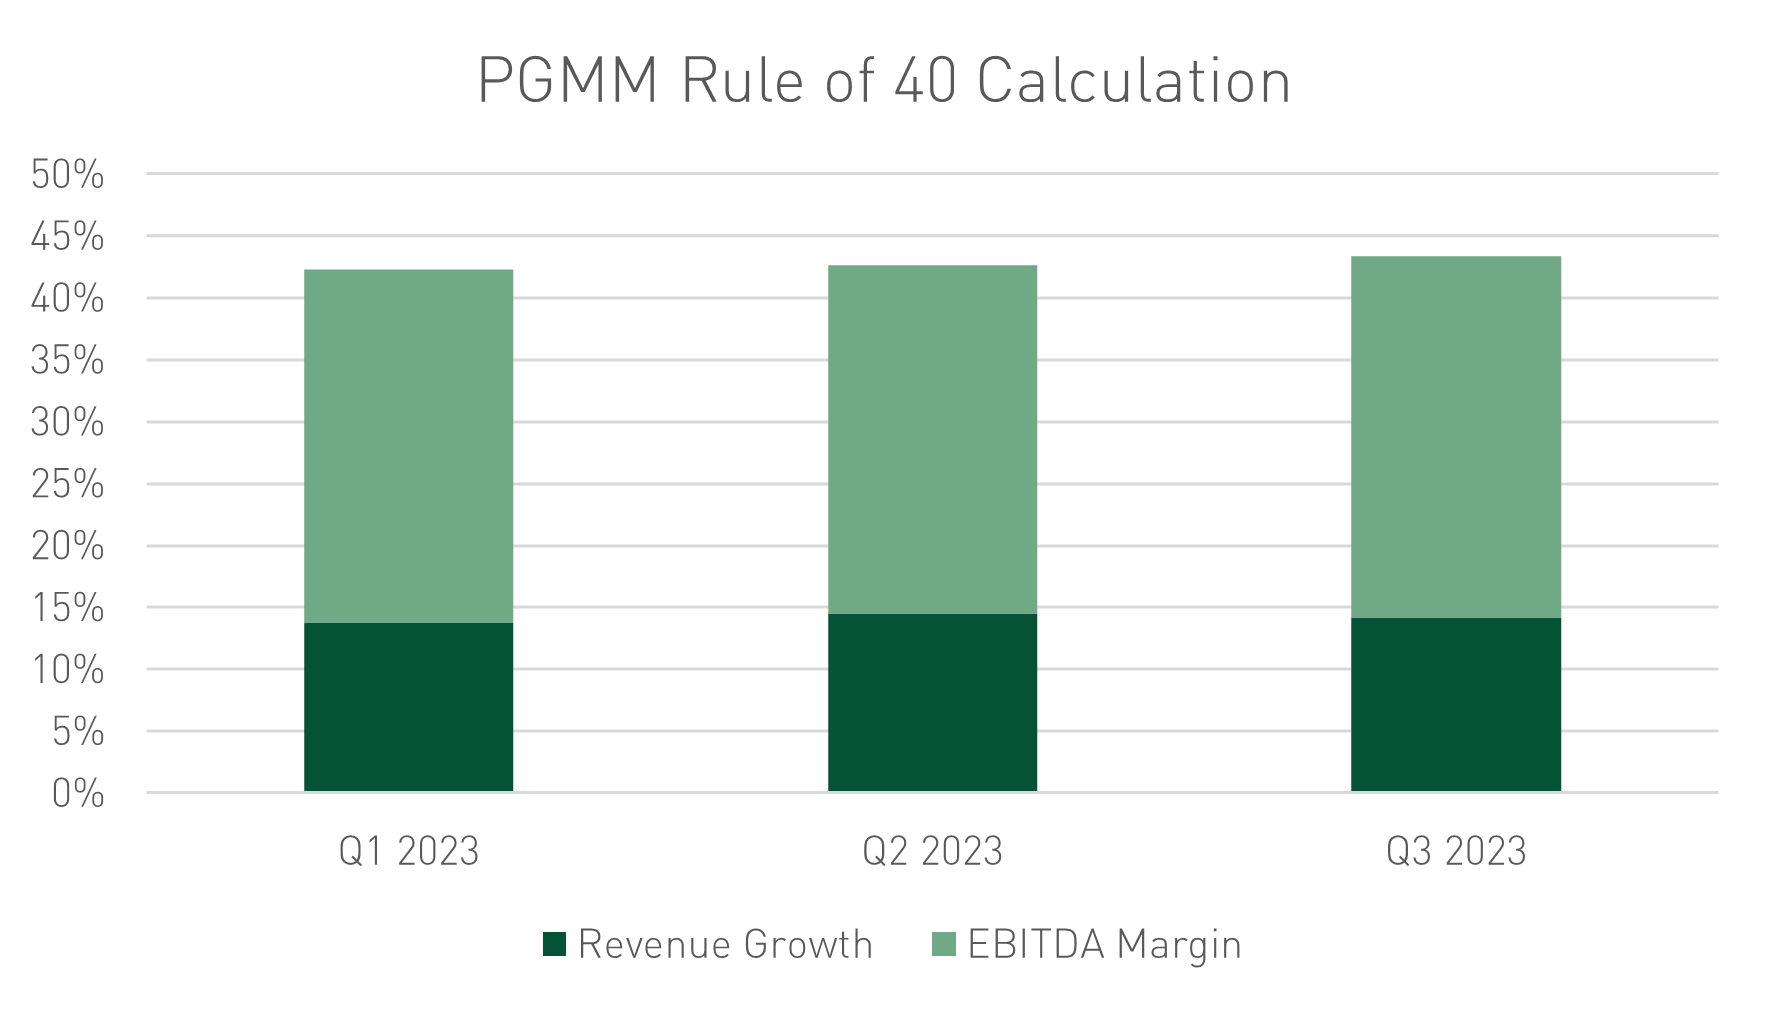
I also examined third party data to understand how the trend is playing out in private markets. According to the OpenView 2023 SaaS benchmarks report, companies with over $50 million in ARR have a median Rule of 40 of 33%. And median growth rates for private companies are down across all four categories compared to 2021, with the over $50 million in ARR cohort growing at 25%. A private credit firm’s report on private middle market companies stated that its technology group grew revenue 14% in the third quarter.
Conclusion
Looking ahead to 2024, the public software market will be shaped by the existing interest rate environment, “optimized” cost structures, and gradually improving demand. Our analysis shows that growth has decelerated and so far, companies have not provided widespread outlooks that growth will reaccelerate over the next few months. However, when software companies accelerate growth, sales multiples increase.
Last quarter I emphasized that companies demonstrating growth in the current environment would see their valuations rewarded, and this trend has materialized. Companies in our small cap index saw their valuations increase, graduating to the larger indices. And companies that grew above the median growth rate for both PGGE and PGMM command a premium valuation.
To capitalize on the convergence between PGMM and PGGE and find “good” companies with “good” valuations. let’s take the stance that 20% growth is aspirational. This perspective sets the stage for identifying companies with growth potential and profits available at a discount.
Fundamentally, I think that characteristics of those types of companies include:
Companies that improved their profitability while growth rates were unaffected.
Companies that maintained or improved their growth rates but saw little appreciation in their valuations.
And small cap companies that have sustained or reaccelerated growth with improved margins.
The first point could signal “mission criticality” of the company’s solutions. The second point will take extra understanding of why valuations did not appreciate, whether the company’s story is misunderstood or the stock lacks coverage from the research community. And lastly, small cap valuations have historically traded at a discount, but those that can outperform their peers have upside through closing the valuation gap.
This past year was tumultuous for technology stock valuations but we now have more clarity on macro events and company operating plans for next year. With more information and barring any 2024 outlook surprises, paying for growth at a reasonable price will be more attainable over these next few months. Picking winners is easier said than done, but PGMM company valuations have stayed within historical ranges and present an interesting buying opportunity for investors looking to take advantage multiple appreciation now that growth expectations have reset.
Disclosures
Actual financial data and estimates for the calendar year ending 2023 were pulled from FactSet as of 11/27/2023.
Investing involves risk, including the loss of all or a significant portion of amounts invested. Past performance is not a guarantee of future results.
The information contained herein is for informational purposes only and should not be considered investment advice. Opinions, estimates, forecasts, and statements of financial market trends that are based on current market conditions constitutes our judgment and are subject to change without notice. All information with respect to industry data has been obtained from sources believed to be reliable and current, but accuracy cannot be guaranteed. Certain economic and market information contained herein has been obtained from published sources and/or prepared by other parties and current as of the date of publication shown.
Investors cannot invest directly in an index. Indices may change over time. Indices are not an investment and, therefore, have no investment performance history. Index performance does not include risks, fees, or other costs. Past index performance is no indication of future results for the index or for any investment.
IWM-Tech – Consists of all Packaged Software stocks as classified by FactSet within the iShares Russell 2000 ETF (IWM). The iShares Russell 2000 ETF (IWM) seeks to track the investment results of an index composed of small-capitalization U.S. equities.
IGV - iShares Expanded Tech-Software Sector ETF – The iShares Expanded Tech-Software Sector ETF seeks to track the investment results of an index composed of North American equities in the software industry and select North American equities from interactive home entertainment and interactive media and services industries.