ParkerGale Indices: First Quarter 2023 Earnings Update
What We’re Updating
Welcome to our first quarterly update to the indices that we developed in “What’s a Software Company Worth?”. Here is a recap of each index:
PG Growth Equity (PGGE): All public software companies that grew over 25% in a given calendar year irrespective of profitability.
PG Middle Market Buyout (PGMM): All public software companies that grew between 5% and 25% in a given calendar year, while also maintaining at least 10% EBITDA margins in the same year.
PG Growth Equity Small Cap (PGGE-SC): Public software companies with a market cap between $250 million and $2 billion that grew over 25% in a given calendar year irrespective of profitability.
PG Middle Market Buyout Small Cap (PGMM-SC): Public software companies with a market cap between $250 million and $2 billion that grew between 5% and 25% in a given calendar year, while also maintaining at least 10% EBITDA margins in the same year.
We refreshed the data as of June 1, 2023 and updated our charts to include forward estimates for sales and EBITDA multiples, revenue growth, and EBITDA margin.
Before We Dive In
The first half of this year had a lot going on. The U.S. Labor Department reported favorable inflation numbers for March and April and the unemployment rate remains low. The Fed raised rates again, regional banks underwent a crisis, and a debt-ceiling standoff drove negative market sentiment. And that followed low expectations coming out of fourth quarter earnings.
Recapping fourth quarter earnings, we learned of some general themes that set expectations for 2023. At the end of last year, company results beat consensus estimates, but at a lower rate than they did in the past. Additionally, companies issued 2023 guidance trailing consensus optimism. And surveys suggested that CIOs expected IT budgets to decrease or remain the same for 2023. These themes reflected a weakening demand environment and a shifting towards profitability versus growth. Now that the first quarter has concluded and companies have reported, results have shown that those themes have held true.
Usually software companies increase their guidance if the business outperforms during the quarter. But this quarter, full year guidance estimates for 2023 remained unchanged on average, even after most companies beat their quarterly estimates. On earnings calls, management teams said that customers are seeking higher levels of approval for closing deals. That commentary explains elongated sales cycles, demonstrating that spending is top of mind. Also, many software companies have announced cost-cutting plans and restructurings. Another sign, that profitability trumps growth in 2023.
So with that backdrop, let’s see how valuations performed after the first quarter.
How Valuations Reacted After the First Quarter
EV/Sales
This chart contains sales multiples for ParkerGale Middle Market Buyout (PGMM) and ParkerGale Growth Equity (PGGE) compared to the iShares Expanded Tech-Software Sector ETF (IGV). Most companies have reported for the first quarter and sales multiples have remained stable for PGMM at 7.4x calendar 2023 estimates versus 6.8x calendar 2022. For PGGE, multiples also stabilized at 7.4x calendar 2023 estimates versus 7.4x calendar 2022. The convergence of multiples mirrors a trend we saw over the past 20 years. During low points, PGGE tends to converge with PGMM, rather than trade at a premium.

The next chart also contains sales multiples, but for the small cap indices. Small cap sales multiples traded at a discount to the broader universe, in line with the historical average. Sales multiples for PGMM-SC were 4.3x after the first quarter compared to 3.9x in 2022. Sales multiples for PGGE-SC increased about half a turn to 5.7x. At its peak, PGGE-SC traded at a three to four turn premium to PGMM-SC, but now the spread has narrowed. PGGE-SC still trades at a premium to PGMM-SC but the index of PGGE-SC shrunk from 23 stocks at the end of last year to three stocks for this quarter. Five of the companies found in PGGE-SC at the end of last year moved to PGMM-SC this quarter. And PGMM-SC grew to 14 stocks this quarter, up from nine in 2022.

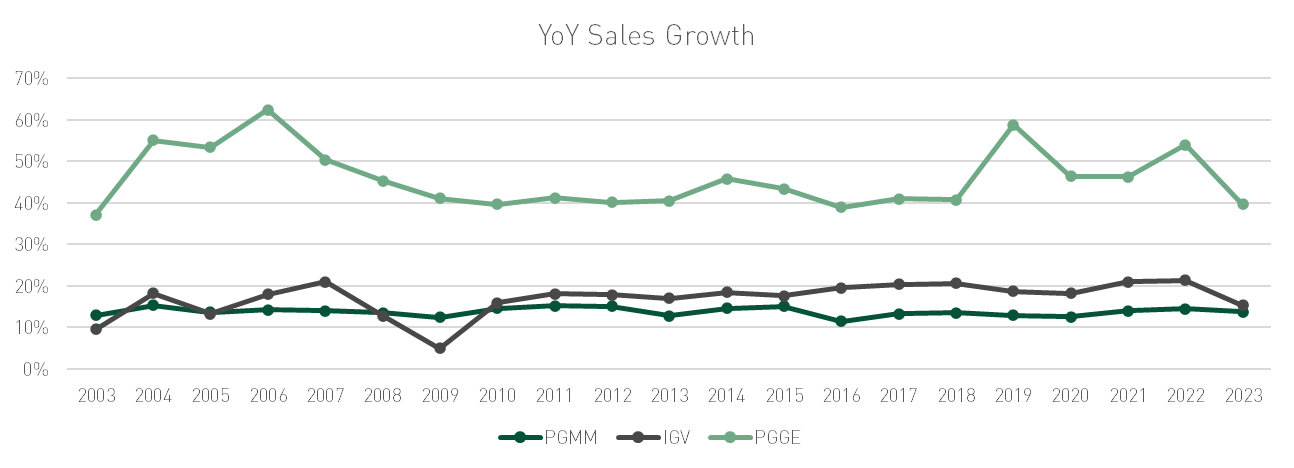
YoY Sales Growth
Below we chart annual sales growth. PGGE growth rates declined to 40% on average in 2023, below our 20-year average of 46% but still three times as fast as PGMM. PGMM was stable, with the cohort growing 14% on average. Once again, this demonstrates the consistent growth achieved by the middle-market companies.
Smaller cap companies exhibit a similar trend. Growth rates for PGGE-SC declined to 21% for the estimated 2023 annual growth, versus 36% in 2022, signaling a deceleration of growth. PGMM-SC did not change much, growing 13% on average, down from 15% in 2022. More telling is the lack of companies that made it into the PGGE-SC index. Remember, the criteria for these types of companies is 25% or more revenue growth and $250 million to $2 billion market cap. Using our benchmark of software companies within the iShares Russell 2000 ETF (IWM-Tech) as a bigger sample size, we still see that growth dropped off quite a bit for the smaller cap companies. The benchmark’s growth rate on average dropped to 9% for 2023, versus 27% in 2022. The number of companies in PGGE-SC shrinking and PGMM-SC growing is a salient point. Companies are focusing on profits over growth and growth is decelerating.

EV/EBITDA
EBITDA multiples reign supreme, still trading above 20x even at trough valuations for sales multiples. EBITDA multiples for PGMM increased to 28.1x versus 23.6x at the end of 2022. And EBITDA Margins for PGMM decreased to 29% from 31%, stable given the movement of some faster growth names to PGMM. Investors reallocating portfolios for profitable companies likely drove the increase in EBITDA multiples. And in 2023, there are more companies that fit the PGMM criteria. By our count, PGMM grew to 80 companies in 2023, up from 55 in 2022. But, PGGE shrunk to 27 companies from 70.

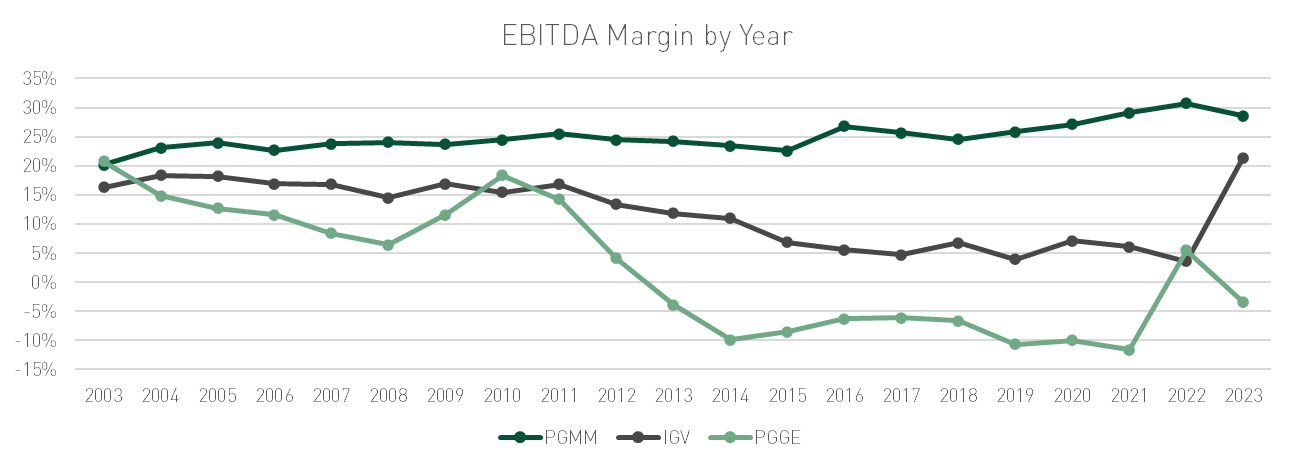
This chart of EBITDA margins shows the swing back to profitability that many of the PGGE companies endured towards the end of last year. And that trend has carried into the first quarter. Right now, the average EBITDA margin for PGGE companies sits at negative 3%, so lower than the end of 2022, but still close to break even. If we pair that with the 40% growth rate for the same cohort, we get close to a Rule of 40. The IGV benchmark saw the biggest change in EBITDA margin. IGV's average EBITDA margin was 21% for 2023, up from 4% in 2022 and the highest over the 20 year period. This also ended an eight year stretch of single digit EBITDA margins for IGV. In 2022, 39% of IGV companies had negative EBITDA margins versus 12% in 2023, driving the 21% average.
The next two charts describe EBITDA valuations and margins for our small cap index, PGMM-SC. EBITDA valuations decreased to 20.4x from 23.6x at the end of 2022 and the IWM-Tech benchmark decreased to 21.2x from 24.9x. Though we calculate a decrease in multiples, EBITDA multiples have traded in the 20x to 25x range over the past four years. And the average EBITDA multiple of PGMM-SC newcomers was 14.9x, which drove down the overall average for 2023. Remember, companies that were PGGE-SC last year transitioned to PGMM-SC this year.

EBITDA margins for both PGMM-SC and IWM-Tech increased, reflecting that companies are getting profitable. The EBITDA margins for PGGE-SC are not meaningful, because the group only includes three companies. If we look at the percentage of companies profitable, 60% of PGGE companies were profitable, slightly below the 68% we saw in 2022. Again, PGGE-SC isn’t as meaningful, but the companies that moved from PGGE-SC to PGMM-SC had an average EBITDA margin of 22% in 2023. If you doubted that companies cared about profits more than last year, this chart repeats what I said before. Companies are shifting from growth to profitability, and investors are rewarding those companies for it.


Conclusion
Our first quarter of updates has shown much of what we saw in the fourth quarter. Sales multiples dropped to five year averages and converged at the end of 2022. Sales multiples usually increase when growth accelerates. And when growth accelerates, the faster growing companies trade at a premium. After the first quarter, 2023 growth rates decelerated for PGGE, PGGE-SC, and PGMM-SC. And PGMM growth rates were flat. The lack of sales growth acceleration for the 2023 outlook explains why the multiples in our indices didn't change much. Companies across the board are tapping the brakes on their growth engines and although the PGGE and PGGE-SC companies may still be sprinting ahead at three times the pace of their middle-market counterparts, our data suggests a shift towards a more measured and sustainable growth strategy.
So the shift should be good for EBITDA multiples right? Our analysis showed that EBITDA multiples increased or traded in their historical ranges. And the favorability of EBITDA over growth likely drove that trend. On many earnings calls, management teams expressed the desire to become more profitable. They described divestments and cost-cutting plans, supporting our data that EBITDA margins increased and the number of growth companies getting closer to break-even increased. At some point, chasing growth was bound to end and the first quarter was one of many upcoming quarters where that has begun to play out. Capital was cheaper over the past decade which fueled those growth engines. But the demand environment has also changed. Software guidance for 2023 was flat for enterprise software companies on average during the first quarter, signaling tighter budgets from customers. So even if companies did ramp up investment in sales and marketing, the demand may not exist. The market's appetite for EBITDA is increasing as the year goes on, and kudos to those companies that have flipped to profitability. It is a tough undertaking, but those companies deserve a premium valuation in our view.
Predicting investor behavior is hard. But, investor preferences are unlikely to flip back to growth over the near term as inflation, lack of demand, and lack of liquidity persist. And we would expect continued rerating of growth-oriented software companies in the private and public markets as 2023 marches on. Our data has played a consistent message: profits over growth. And that message is loud and clear.
Disclosures
Actual financial data and estimates for the calendar year ending 2023 were pulled from FactSet as of 6/1/2023.
Investing involves risk, including the loss of all or a significant portion of amounts invested. Past performance is not a guarantee of future results.
The information contained herein is for informational purposes only and should not be considered investment advice. Opinions, estimates, forecasts, and statements of financial market trends that are based on current market conditions constitutes our judgment and are subject to change without notice. All information with respect to industry data has been obtained from sources believed to be reliable and current, but accuracy cannot be guaranteed. Certain economic and market information contained herein has been obtained from published sources and/or prepared by other parties and current as of the date of publication shown.
Investors cannot invest directly in an index. Indices may change over time. Indices are not an investment and, therefore, have no investment performance history. Index performance does not include risks, fees, or other costs. Past index performance is no indication of future results for the index or for any investment.
IWM-Tech – Consists of all Packaged Software stocks as classified by FactSet within the iShares Russell 2000 ETF (IWM). The iShares Russell 2000 ETF (IWM) seeks to track the investment results of an index composed of small-capitalization U.S. equities.
IGV - iShares Expanded Tech-Software Sector ETF – The iShares Expanded Tech-Software Sector ETF seeks to track the investment results of an index composed of North American equities in the software industry and select North American equities from interactive home entertainment and interactive media and services industries.