ParkerGale Indices: Second Quarter 2023 Earnings Update
What We’re Updating
Today we are updating our indices that we developed in “What’s a Software Company Worth?”. Here is a recap of each index:
PG Growth Equity (PGGE): All public software companies that grew over 25% in a given calendar year irrespective of profitability.
PG Middle Market Buyout (PGMM): All public software companies that grew between 5% and 25% in a given calendar year, while also maintaining at least 10% EBITDA margins in the same year.
PG Growth Equity Small Cap (PGGE-SC): Public software companies with a market cap between $250 million and $2 billion that grew over 25% in a given calendar year irrespective of profitability.
PG Middle Market Buyout Small Cap (PGMM-SC): Public software companies with a market cap between $250 million and $2 billion that grew between 5% and 25% in a given calendar year, while also maintaining at least 10% EBITDA margins in the same year.
We refreshed the data as of August 31, 2023 to capture second quarter actuals. And we updated 2023 forward estimates in our charts for sales and EBITDA multiples, revenue growth, and EBITDA margin.
Before We Dive In
The second quarter economic indicators told a story like the beginning of the year. The unemployment rate was 3.5% for the second quarter, mirroring 3.5% in the first quarter and below 3.6% at the end of 2022. Unemployment rate estimates for 2023 imply an increase to 3.7% at year end. The federal reserve increased its federal funds target rate another 25 basis points to 5.25%, and analysts expect at least one more rate increase in November or December. And on the inflation front, quarter over quarter CPI grew 2.7%, a far cry from 9.7% this same time last year. In late August, the FOMC reaffirmed it is targeting a 2% inflation target. To achieve 2% inflation, a softening labor market and a period of below-trend economic growth are required, so interest rates are expected to stay higher for longer.
Higher interest rates will affect enterprise software company valuations. And at the end of 2022 and first quarter of this year enterprise software companies reduced workforces and cut costs to become profitable, impacting growth. In conjunction with that strategy shift, enterprise software buyers began to “optimize” software spending, reducing demand. Optimization is best defined as reducing the number of modules or seats purchased as companies evaluate the “nice to have” vs “need to have”. So a combination of unfavorable market conditions and operational changes have led to lower valuations.
Investors were concerned about growth heading into 2023 and the first quarter results did not quite alleviate that concern. Companies are facing tough comps to 2022, a year of strong growth post-COVID. But as of August 31,2023, the iShares Expanded Tech-Software Sector ETF (IGV) is up 41% on a year-to-date basis while the S&P 500 is up 17% and the Russell 2000 is up 8%. When we peel back the data later, we will see why technology stocks have performed well despite the backdrop.
In 2021 and 2022, enterprise software buyers over invested both in hiring and software spend. Both are now right-sizing. If we zoom in on analyst expectations for enterprise software companies, the general theme is that much of the pain (i.e., revenue deceleration, reducing guidance, or missing quarterly numbers) from optimization should wane over the back half of the year. Additionally, optimization trends affect net revenue retention (NRR), a key metric for enterprise software companies. If customers reduce their rate of expansion and churn increases simultaneously, we expect NRR to decrease. NRR sits below the highs of 120%-plus.
In my view, investors began to understand the shift to profitability from growth after fourth quarter and first quarter earnings, and management teams set 2023 guidance to a conservative level. Now that we have six to seven months of data, third and fourth quarter performance is clearer. The implied revenue growth rate over the second half of the year should decelerate to meet full year guidance. And a deceleration of revenue growth aligns with expectations for a weakening demand environment.
So, let’s see how valuations performed after the second quarter.
How Valuations Reacted After the Second Quarter
EV/Sales
First, we will chart the change in 2023 sales multiples between quarters for ParkerGale Middle Market Buyout (PGMM) and ParkerGale Growth Equity (PGGE). Sales multiples for PGMM companies were unchanged compared to the first quarter. While sales multiples for PGGE increased to 9.7x on average, a premium over the IGV and PGMM.

The line chart below contains sales multiples for PGMM and PGGE compared to IGV. During low points, PGGE tends to converge with PGMM, rather than trade at a premium. The first quarter and the end of 2022 were periods of convergence. We have not exited the period of convergence yet, but the PGGE names are beginning to command a premium again, despite a deceleration in growth.
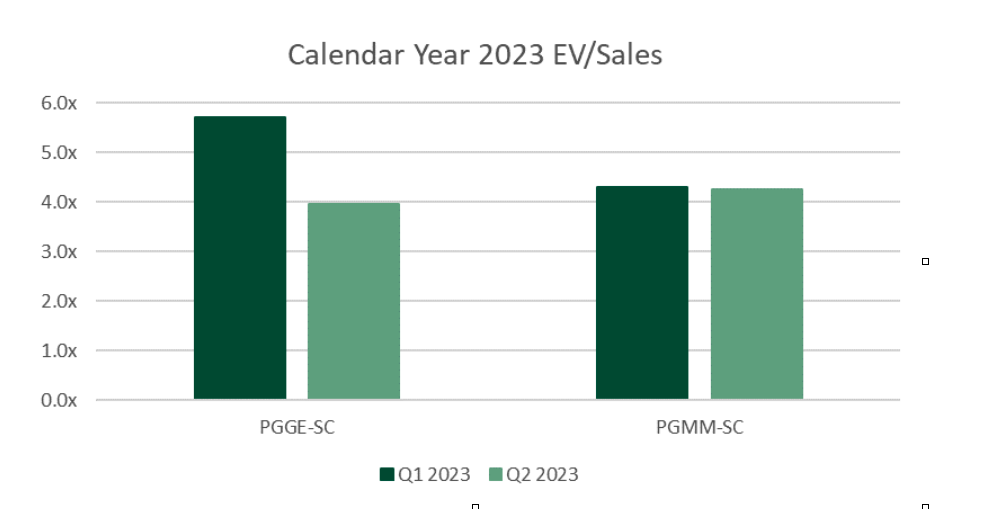
The next chart also contains sales multiples, but for the small cap indices. Small cap sales multiples traded at a discount to the broader universe, in line with the historical average.
The 2023 average forward sales multiple for PGMM-SC was 4.3x after the second quarter, unchanged from the first quarter. The sales multiple for PGGE-SC is not meaningful because the index shrunk to one company. Since PGGE-SC shrunk for the second quarter in a row, let’s take a deeper look at the cause.
At the end of 2022, PGGE-SC contained 23 companies that fit our criteria –growing revenue 25% or greater and market cap between $250 million and $2 billion. After the first half of this year, eighteen of those companies fell out of the index because of growth deceleration (seven of the eighteen companies were profitable so they moved over to PGMM-SC). Two companies grew above 25%, but their market capitalization increased above $2 billion. And two more companies were acquired by private equity firms.
The bottom line: sales growth deceleration affected our small cap index more than our market cap agnostic index. If we included the PGGE-SC cohort at the end of 2022 in our 2023 sales growth analysis, we see an average growth rate of 17%, down from 36% in 2022. In other words, growth for 2022 PGGE-SC was more than cut in half. Companies growing over 20% were either too large or too profitable for inclusion in PGGE-SC. Said another way, small cap names that were able to maintain high growth had their sales multiples rerate higher.

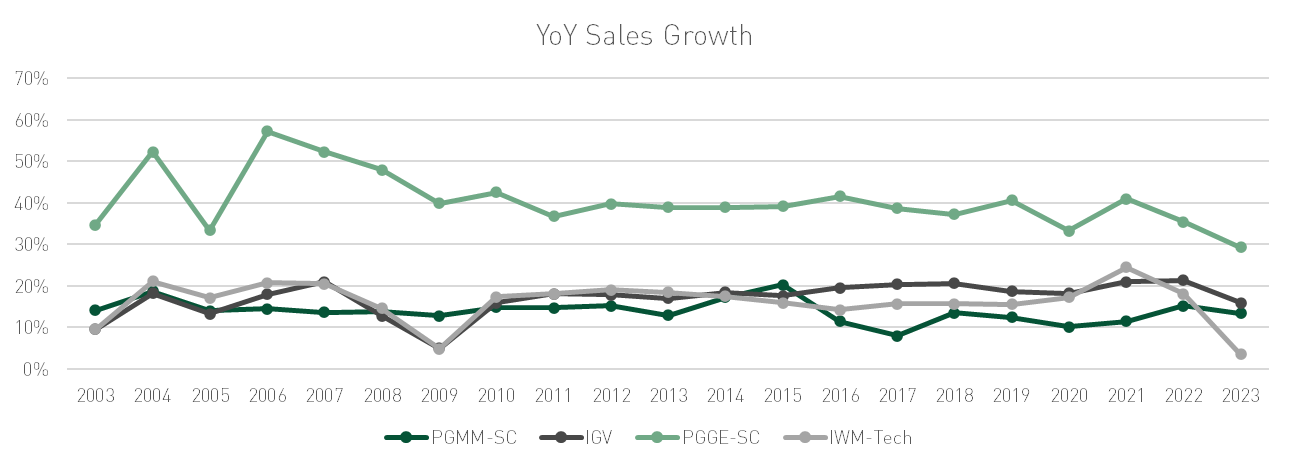
YoY Sales Growth
Below we chart annual sales growth. The average estimated 2023 sales growth rate for PGGE is 35%, down from 40% at the end of the first quarter. This growth rate is below the 20-year average of 46%. PGMM grew 15% on average, demonstrating consistent growth.

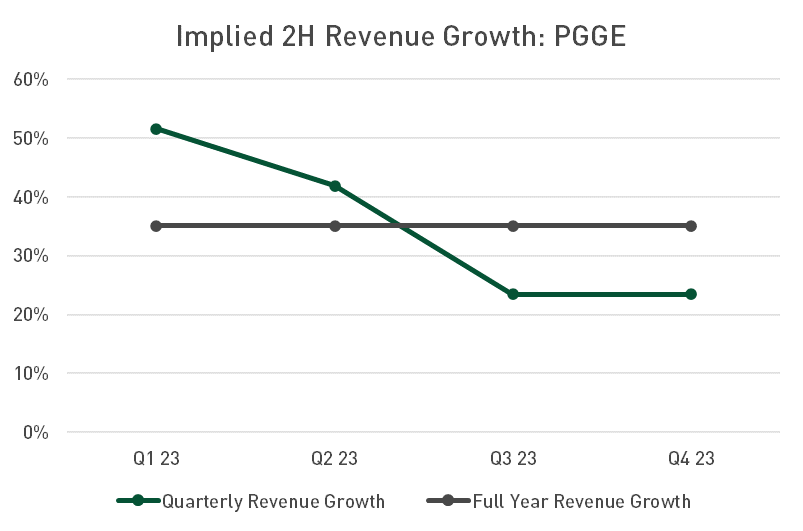
Most enterprise software companies have reported at the time of this writing, and the first half data helps us calculate an implied growth rate for the second half of 2023. We chart those quarterly growth rates against full year estimates to visualize growth trends for the rest of 2023.
Over the first half of the year, PGGE grew faster than guidance for the full year of 35%. This implies a deceleration of growth over the back half of the year.
PGMM also grew faster than guidance for the full year of 15%. This also implies a deceleration of growth over the back half of the year. However, the deceleration of growth is more subtle for PGMM compared to PGGE.

Companies in the small cap index, PGMM-SC, exhibit a similar trend. The average 2023 sales growth estimate for PGMM-SC companies is 13%. And our small cap benchmark, software companies within the iShares Russell 2000 ETF (IWM-Tech), is expected to grow 4% in 2023. Across our four indices, companies are focusing on profits rather than growth and growth is decelerating.
EV/EBITDA
Finally, we examine EBITDA margins and multiples for our indices. EBITDA multiples for PGMM were 28.5x, in line with last quarter. EBITDA margins are 28%, flat when compared to the end of the first quarter and down from 31% at the end of 2022. The number of companies in each index was also stable between quarters.

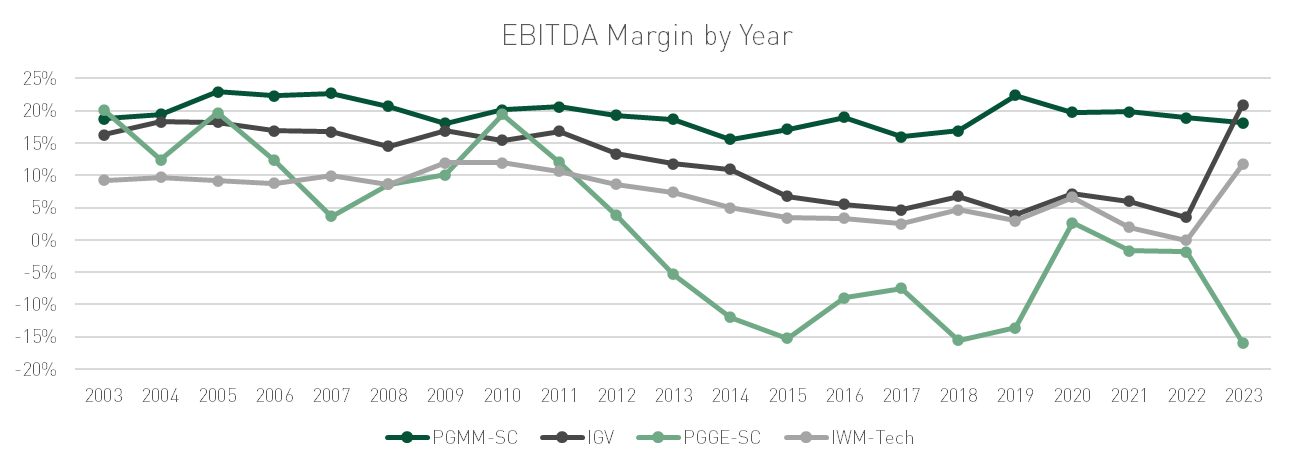
This chart of EBITDA margins shows the swing back to profitability that many PGGE companies achieved towards the end of last year. And that trend has carried into the second quarter. The average EBITDA margin for PGGE companies is now 6%. Profitable PGGE companies traded at a premium to the PGGE universe, and the faster growing companies were most expensive. That tells me that investors will pay a premium for growth and profits. More importantly, the first half actuals and full year guidance imply an increase in EBITDA margins over the second half for the companies in our indices. So, profitability is becoming more important to achieving the Rule of 40 on average for the universe compared to most recent years. For comparison, average EBITDA margins for the IGV benchmark are at 21% for 2023, as companies continue to shift to positive EBITDA margins.

We completed the same analysis for EBITDA margins as we did for sales growth below. PGMM is expected to see EBITDA margin expansion over the back half of the year to achieve full year expectations. PGGE will also need to expand EBITDA margins over the second half of the year to achieve full year expectations.


The next two charts describe EBITDA valuations and margins for our small cap index, PGMM-SC. EBITDA multiples for PGMM-SC increased to 21.8x this quarter compared to 20.4x last quarter. The increase in EBITDA multiples coincided with a decrease in EBITDA margin to 18% on average. IWM-Tech EBITDA multiples were 13.1x and EBITDA margins were 12%. PGMM-SC continues to trade in the 20x to 25x range over the past four years.

Because we don’t filter for profitable companies when looking at PGGE, we can look at the percentage of profitable companies in the index. 70% of PGGE companies were profitable, up from 68% in 2022 and an increase from 60% in the first quarter.

Conclusion
The second quarter results gave investors more data to understand the growth versus profitability battle waged by management teams over the past six to nine months.
Sales growth will be an uphill battle for enterprise software companies. Conservative guidance from management teams was on the mark, and although companies beat estimates, investors still expect sales growth to be lower than last year. Yet, valuations for our highest growth companies (PGGE) have improved. PGGE now trades at a premium to PGMM. Small caps, which perennially trade at a discount, saw a few companies close that discount gap. The companies that sustained fast growth graduated from our PGGE-SC index as their valuations rerated. Other fast growth small cap companies expect to grow in the high teens, giving us a clearer picture of a growth floor. Companies that can still grow fast this year will have their multiples rerate. If you were on the sidelines for the past two quarters, waiting for the bottom of growth stock valuations, now is a good time to reconsider. High growth or high growth and profitable companies are both commanding a premium and although we may not reach the valuation highs of 2021, the current level is a nice entry point.
On the other side of the battle, profitable enterprise software companies will see EBITDA margins improve over the remainder of the year, even as growth declines. In the three quarters that we have covered, PGGE has transitioned from unprofitable to break-even to profitable. And that march of profitability should continue upward over the second half of the year. Valuations for PGMM companies held within historical ranges and increased for PGMM-SC despite the revenue growth decline. The lack of deviation from historical ranges is positive for value buyers. And for private software investors, it instills confidence for rationalizing entry and exit points.
The first two quarters have shown us what investors are willing to pay for. If you can still grow in this environment, your valuation will be rewarded. The list of companies that fit those criteria is shorter, but worth the premium. Management teams sought to describe the tumultuous year 2023 could be from a revenue growth perspective and so far, investors have digested that news given the stability of multiples between quarters. Coming out of second quarter earnings, investors have a clearer picture into the rest of 2023 and cost structures for customers and companies alike have begun to stabilize which allows investors to get a better sense of the go-forward model. And if you believe that interest rates will be higher for longer, the labor market will continue to be tight, and cost rationalization will continue over the short term, now is the time to pay up for growth.
Disclosures
Actual financial data and estimates for the calendar year ending 2023 were pulled from FactSet as of 8/31/2023.
Investing involves risk, including the loss of all or a significant portion of amounts invested. Past performance is not a guarantee of future results.
The information contained herein is for informational purposes only and should not be considered investment advice. Opinions, estimates, forecasts, and statements of financial market trends that are based on current market conditions constitutes our judgment and are subject to change without notice. All information with respect to industry data has been obtained from sources believed to be reliable and current, but accuracy cannot be guaranteed. Certain economic and market information contained herein has been obtained from published sources and/or prepared by other parties and current as of the date of publication shown.
Investors cannot invest directly in an index. Indices may change over time. Indices are not an investment and, therefore, have no investment performance history. Index performance does not include risks, fees, or other costs. Past index performance is no indication of future results for the index or for any investment.
IWM-Tech – Consists of all Packaged Software stocks as classified by FactSet within the iShares Russell 2000 ETF (IWM). The iShares Russell 2000 ETF (IWM) seeks to track the investment results of an index composed of small-capitalization U.S. equities.
IGV - iShares Expanded Tech-Software Sector ETF – The iShares Expanded Tech-Software Sector ETF seeks to track the investment results of an index composed of North American equities in the software industry and select North American equities from interactive home entertainment and interactive media and services industries.