ParkerGale Indices: Fourth Quarter 2023 Earnings Update
What We’re Updating
Today we are updating our indices that we developed in “What’s a Software Company Worth?”. Here is a recap of each index:
PG Growth Equity (PGGE): All public software companies that grew over 25% in a given calendar year irrespective of profitability.
PG Middle Market Buyout (PGMM): All public software companies that grew between 5% and 25% in a given calendar year, while also maintaining at least 10% EBITDA margins in the same year.
PG Growth Equity Small Cap (PGGE-SC): Public software companies with a market cap between $250 million and $2 billion that grew over 25% in a given calendar year irrespective of profitability.
PG Middle Market Buyout Small Cap (PGMM-SC): Public software companies with a market cap between $250 million and $2 billion that grew between 5% and 25% in a given calendar year, while also maintaining at least 10% EBITDA margins in the same year.
We refreshed the data as of March 8, 2024 to capture fourth quarter actuals in our charts for trailing sales and EBITDA multiples, revenue growth, and EBITDA margin. We will also discuss economic data and company outlooks across the four indices to understand trends for 2024.
Before We Dive In
During the fourth quarter of 2023, inflation came within expectations, and the Federal Funds target rate range settled at 5.25% to 5.50%. Analysts are predicting at least one rate decrease in 2024 and the Fed’s comments this month have supported that prediction so far. Jerome Powell said that he believes the central bank will begin to lower borrowing costs in 2024 but policymakers still needed to gain “greater confidence” that inflation was conquered before making a move. He also stated that the policy rate is “likely at its peak for this tightening cycle”. With Powell’s comments in mind, inflation and employment prints would be key indicators to keep an eye on over the next few quarters to set expectations for rates in 2024.
The stability in rates was likely a key factor in stock performance in 2023. The NASDAQ Composite and IGV index improved 43% and 59% to end 2023. And quarter-to-date, each improved 9% and 8% respectively. Much of the improvement was driven by major players in the indices such as Nvidia, Microsoft, Meta, and Amazon, once again showing their outsized influence. Counter to those outliers, businesses with consumption and seat-based models saw their stock prices underperform during the quarter as they still face IT spend headwinds. Anecdotally, channel checks discussed that software customers went through cost rationalization in 2022 and 2023 rather than optimization, signaling that IT spend headwinds could persist in 2024. In other words, we could be entering a prolonged period of ‘doing more with less’.
Artificial Intelligence (AI) continues to be a major theme across enterprise software. However, most public software companies have not provided data that indicates AI has begun contributing materially to revenue. Some management teams have highlighted the benefits of using AI internally to reduce costs. So analysts may need to shift their view that AI is purely a revenue opportunity.
Optimization trends suppressed customer demand during the quarter and companies across industries have continued to downsize, which negatively impacts seat-based models. Both factors have been reflected in growth rates ending the year. For 2023, average revenue growth for our universe of companies ended the year at 36%, in line with guides coming out of the third quarter, but down from the 40% expectation at the start of the year.
Last quarter I asked whether 20% growth had become aspirational. 2024 outlooks indicate that may be the case. Of the companies included in our analysis, a majority fall in the bucket of 10% to 25% revenue growth for the year. Additionally, the shift to “profits over growth” has caused some high growth investors to argue the merits of the Rule of 40. More on that later, first let’s break down the data from our indices.
How Valuations Reacted after the Fourth Quarter
EV/Sales
Below we chart the change in 2023 sales multiples between quarters for ParkerGale Middle Market Buyout (PGMM) and ParkerGale Growth Equity (PGGE). Sales multiples for PGMM companies increased slightly to 7.7x revenue in the fourth quarter. While sales multiples for PGGE increased a turn to 10.5x on average, at a premium over the iShares Expanded Tech-Software Sector ETF (IGV) and PGMM.

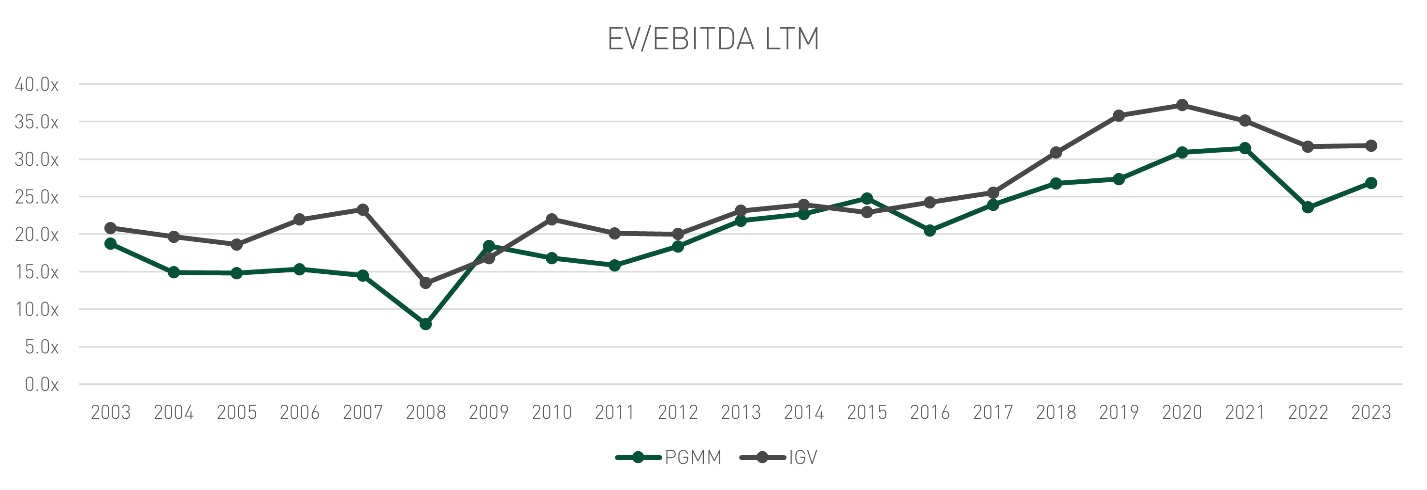
The line chart below contains sales multiples for PGMM and PGGE compared to IGV. The gap between sales multiples has continued to widen. PGGE companies are more profitable now than past quarters and investors have likely started to wrap their head around a new baseline for what “fast growth” companies will look like. Additionally, the stabilization of rates and cost structures in the PGGE names have probably allowed investors to take more risk and shift allocations back to PGGE.

This quarter, 22 out of 79 PGMM companies were valued at 10x EV/Sales or higher. Those companies grew revenue 16%, had EBITDA margins of 35%, and traded at 37x EBITDA, a premium over the PGMM index. In PGGE, 13 companies were valued at 10x EV/Sales or higher and grew revenue on average 35% with EBITDA margins of 13%. Revenue growth for those companies was flat compared to last quarter, but EBITDA margins improved on average. Additionally, that subsegment of PGGE traded at a premium, averaging 15x EV/Sales.
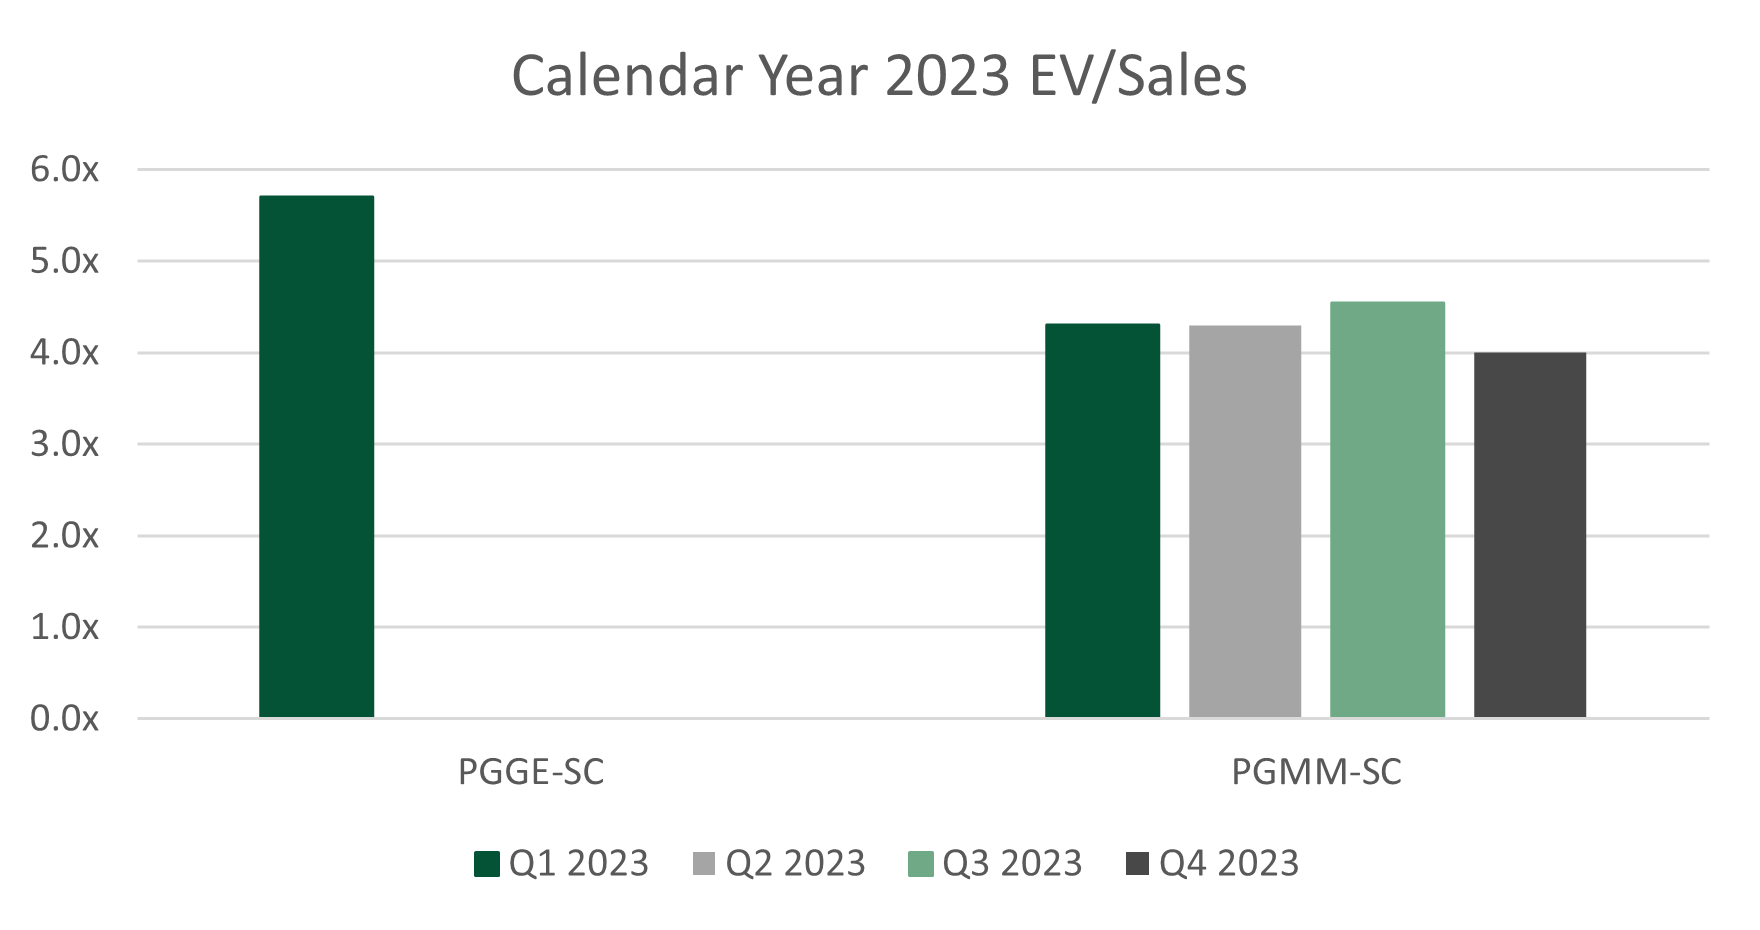
The fourth quarter average LTM sales multiple for PGMM-SC was 4x, below the 4.3x to 4.5x range experienced over the first three quarters. Again, PGGE-SC is not meaningful after the first quarter because the index contained one company.

YoY Sales Growth
Below we chart annual sales growth. Revenue growth for PGGE 2023 ended at 36%, exceeding expectations of 34% from the previous quarter, but below expectations of 40% at the beginning of 2023. PGMM grew 14%, in line with the previous quarter.

Now that companies have provided 2024 outlooks, we can examine investors’ expectations for revenue growth. Analysts are estimating high-teens next twelve-month revenue growth rates for software companies, lower than what the market experienced over the past few years. Across our indices, PGGE companies with available estimates are expected to grow 28% while PGMM companies are expected to grow 10%.
EV/EBITDA
Finally, we examine EBITDA margins and multiples for our indices. EBITDA multiples were in line for PGMM as margins went to 30% from 29%. PGMM-SC had margins of 20% on average and continues to trade in the 20x to 25x EBITDA range, providing a base line for exit expectations.
Most companies in our PGGE index succeeded in transitioning from growth to profitability over the course of 2023. And the entire cohort reached double digits to end the year. PGGE companies that were able to exceed the group EBITDA margin average commanded a premium valuation. Initial outlooks for 2024 have average EBITDA margins for PGGE at 10% currently.


A few venture capital investors have begun discussing replacing or reevaluating the Rule of 40, a popular metric for evaluating software companies. Using the Rule of 40 as a forward-looking metric can be difficult, especially when evaluating high growth companies, but I will leave the debate up to venture capital investors. I use the historical Rule of 40 to understand what management teams are focusing on. To calculate rule of 40, we add the 2023 revenue growth rate and 2023 EBITDA margin.
The chart shows that PGMM and PGGE arrive at the Rule of 40 in two different ways, and that PGGE companies have relied on EBITDA margins more to achieve that rule over the past year.
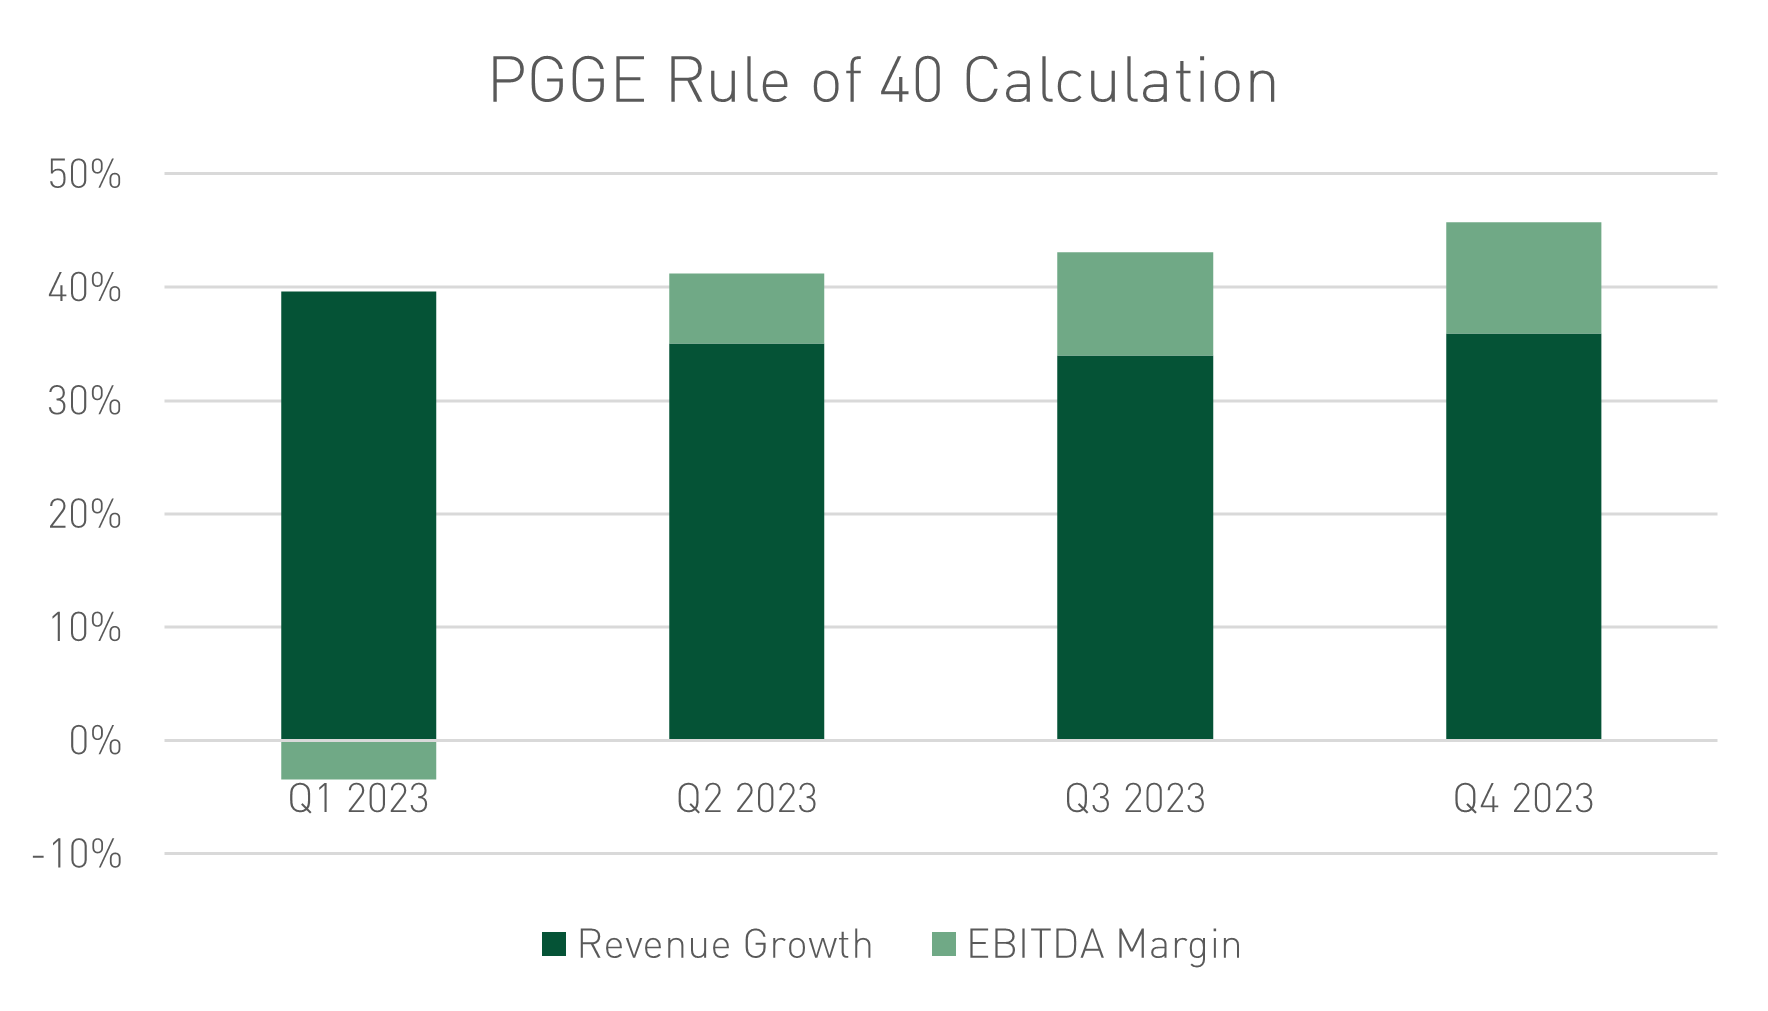

Despite the talk about focusing on profits, PGMM growth rates didn’t suffer. As a result, valuation changes throughout the year did not vary widely. And this provides more insight for folks that appreciate reasonable growth and profits, particularly for private equity investors like us.
Conclusion
The first quarter is near its end and investors have digested initial 2024 outlooks. The most recent inflation print was in line with analysts’ estimates and interest rate expectations have stabilized. And I think that that lands us on a key word for 2024 – stabilization.
Management teams are still working through IT spend headwinds after taking a lot of pain in 2022 and 2023. But a lot of cost rationalization has occurred with even the fastest growing companies generating profits. Valuations for companies that were able to maintain growth and be profitable have seen their valuations rewarded. And investor appetite for growth seems to be increasing again.
Consensus from analysts is that 2024 outlooks have been set at a conservative but achievable level thus far. Identifying “good” companies with “good valuations” in this market can be difficult, but stable multiples could make paying for growth at a reasonable price still seems attainable over these next few months.
Disclosures
Actual financial data and estimates for the calendar year ending 2023 were pulled from FactSet as of 3/8/2024.
Investing involves risk, including the loss of all or a significant portion of amounts invested. Past performance is not a guarantee of future results.
The information contained herein is for informational purposes only and should not be considered investment advice. Opinions, estimates, forecasts, and statements of financial market trends that are based on current market conditions constitutes our judgment and are subject to change without notice. All information with respect to industry data has been obtained from sources believed to be reliable and current, but accuracy cannot be guaranteed. Certain economic and market information contained herein has been obtained from published sources and/or prepared by other parties and current as of the date of publication shown.
Investors cannot invest directly in an index. Indices may change over time. Indices are not an investment and, therefore, have no investment performance history. Index performance does not include risks, fees, or other costs. Past index performance is no indication of future results for the index or for any investment.
IWM-Tech – Consists of all Packaged Software stocks as classified by FactSet within the iShares Russell 2000 ETF (IWM). The iShares Russell 2000 ETF (IWM) seeks to track the investment results of an index composed of small-capitalization U.S. equities.
IGV - iShares Expanded Tech-Software Sector ETF – The iShares Expanded Tech-Software Sector ETF seeks to track the investment results of an index composed of North American equities in the software industry and select North American equities from interactive home entertainment and interactive media and services industries.